Which president had the best economy Comparing GDP

Which president had the best economy Determining which U.S. president presided over the “best” economy is a complex and nuanced question, as economic performance depends on various factors, many of which are beyond a president’s direct control.
Thank you for reading this post, don't forget to subscribe!Metrics like GDP growth, unemployment rates, job creation, inflation, stock market performance, and poverty rates are commonly used to evaluate economic success, but external events like global crises, technological booms, or inherited conditions shape outcomes.
This article examines the economic records of U.S. presidents since World War II, focusing on key indicators, contextual factors, and policy impacts, to assess who oversaw the strongest economy.
A comparative table summarizes the data, and critical analysis highlights why simplistic rankings can be misleading.
Which president had the best economy? Defining a “Good” Economy
A strong economy is typically characterized by:
- High GDP Growth: Real GDP growth of 2–3% annually is considered healthy, balancing expansion without overheating.
- Low Unemployment: Rates below 5% indicate a robust job market.
- Low Inflation: Stable prices, ideally 2–3%, prevent purchasing power erosion.
- Job Creation: Consistent job growth reflects economic vitality.
- Stock Market Performance: Rising markets signal investor confidence, though not always broad prosperity.
- Poverty Reduction: Lower poverty rates suggest equitable growth.
- Debt and Deficits: Manageable deficits relative to GDP indicate fiscal health.
Presidents influence these through fiscal policy (taxes, spending) but face constraints from the Federal Reserve’s monetary policy, global events, and inherited conditions. For example, recessions often begin before a president takes office, skewing perceptions of their record.
Post-World War II Presidents: Economic Overview
To identify the president with the “best” economy, we focus on post-World War II leaders, as modern economic data is more reliable and comparable. Below is an analysis of key presidents, based on data from sources like the Bureau of Economic Analysis, Bureau of Labor Statistics, and academic studies.
Harry S. Truman (1945–1953)
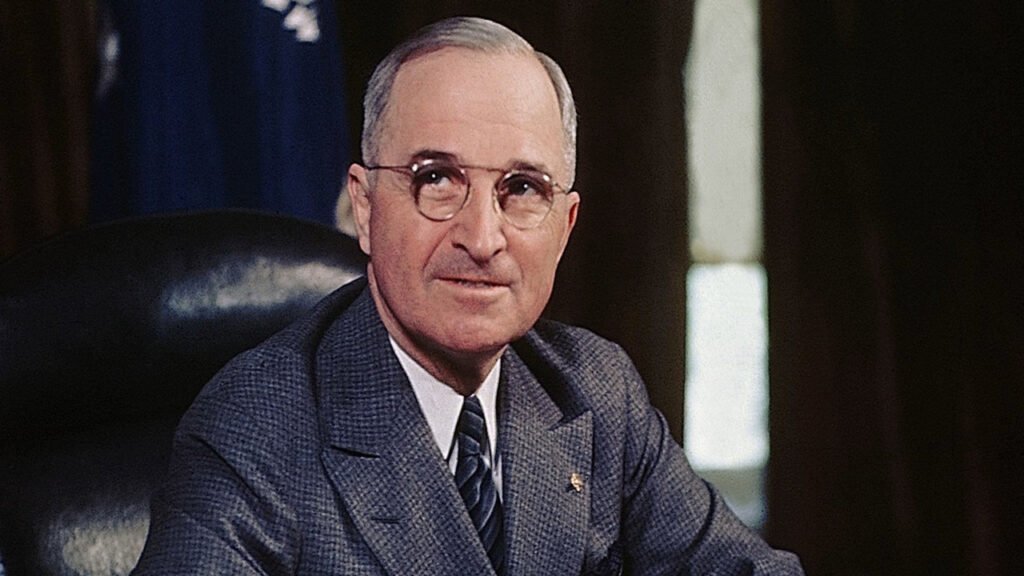
Truman’s presidency saw the post-WWII economic transition, with real GDP growth averaging 1.4% annually due to two mild recessions (1945 and 1948–49). Unemployment remained low, around 4.3% by 1953, and the stock market grew modestly.
However, inflation spiked post-war (peaking at 19.5% in 1947 due to lifted price controls) before stabilizing. Truman’s policies, like the GI Bill, spurred long-term growth, but his tenure was marred by labor strikes and economic volatility.
Dwight D. Eisenhower (1953–1961)

Eisenhower’s economy was stable, with real GDP growth averaging 3%, within the ideal range. Unemployment dropped to 2.5% by 1953 but rose to 6.8% during the 1957–58 recession. Inflation was low (1.4% average), and the stock market (S&P 500) grew steadily.
Eisenhower’s fiscal conservatism and infrastructure investments (e.g., Interstate Highway System) supported growth, though recessions in 1953 and 1957 tempered his record.
John F. Kennedy (1961–1963)

Kennedy’s short tenure saw strong GDP growth (4.4% average), fueled by tax cut proposals and the end of the 1960–61 recession. Unemployment fell from 6.7% to 5.7%, and inflation remained low at 1.2%.
His policies laid the groundwork for the 1960s boom, but his assassination limited direct impact. Kennedy ranks high for economic expansion, though his brief term makes comparisons challenging.
Lyndon B. Johnson (1963–1969)

Johnson’s presidency had the highest post-WWII GDP growth at 5.3%, driven by Great Society programs and Vietnam War spending. Unemployment hit a historic low of 3.4% by 1969, and poverty rates dropped from 19% to 12% due to social programs.
However, inflation rose to 4.7% by 1969, sowing seeds for 1970s stagflation. Johnson’s economy was robust but unsustainable, as spending fueled deficits.
Richard Nixon (1969–1974)
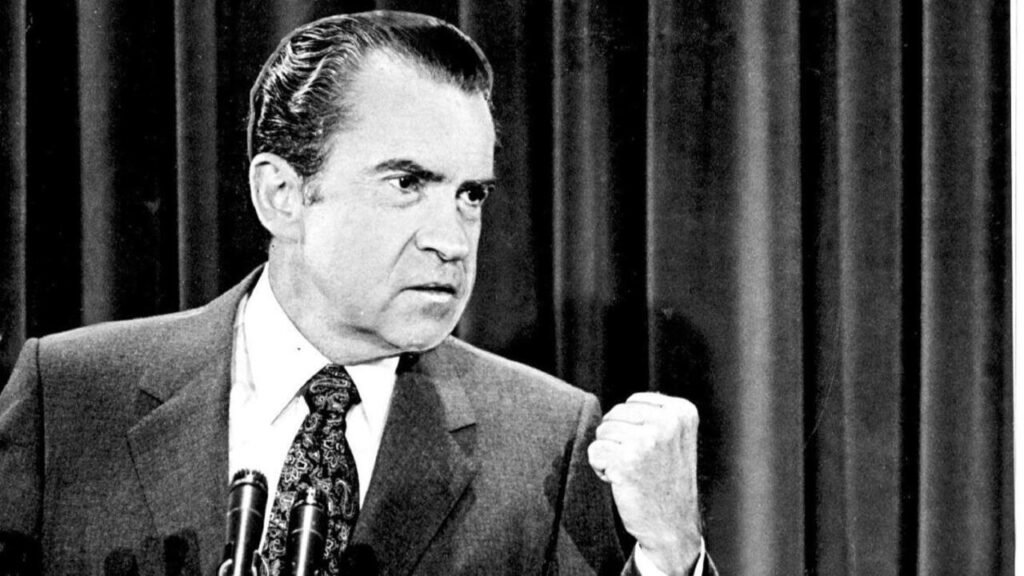
Nixon faced stagflation, with GDP growth at 2.8% but high inflation (6.2% average) and unemployment rising to 5.6%. The 1973–75 recession, triggered by oil shocks, marred his record.
Nixon’s policies, like wage-price controls, had mixed results, and the unlinking of the dollar from the gold standard reshaped global finance. His economy struggled with external shocks.
Gerald Ford (1974–1977)
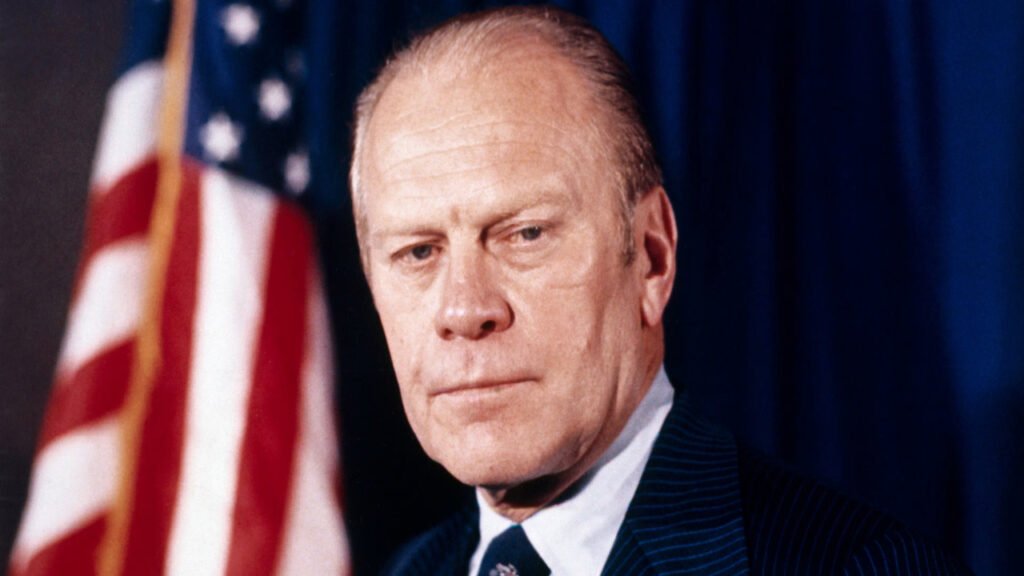
Ford inherited stagflation, with GDP growth at 1.6% and inflation peaking at 11% in 1974. Unemployment hit 8.5% during the 1973–75 recession.
His “Whip Inflation Now” campaign failed to curb prices, and the economy remained weak. Ford’s short tenure and inherited challenges limited his impact.
Jimmy Carter (1977–1981)

Carter’s economy is often criticized, with GDP growth at 3.2% but inflation soaring to 13.5% in 1980 due to oil crises. Unemployment averaged 6.5%, and poverty rates stabilized.
Carter’s deregulation efforts (e.g., airlines) had long-term benefits, but his tenure is remembered for economic malaise, despite some metrics being stronger than perceived.
Ronald Reagan (1981–1989)

Reagan’s economy is celebrated by some, with GDP growth averaging 3.5% and unemployment dropping from 7.5% to 5.3%. The Economic Policy Institute (EPI) scored his economy at 90.8%, the highest post-WWII, due to recovery from the 1981–82 recession.
However, his tax cuts and defense spending tripled the national debt, and inflation averaged 4.1%. The stock market boomed, but inequality grew, with poverty rates declining only slightly.
George H.W. Bush (1989–1993)
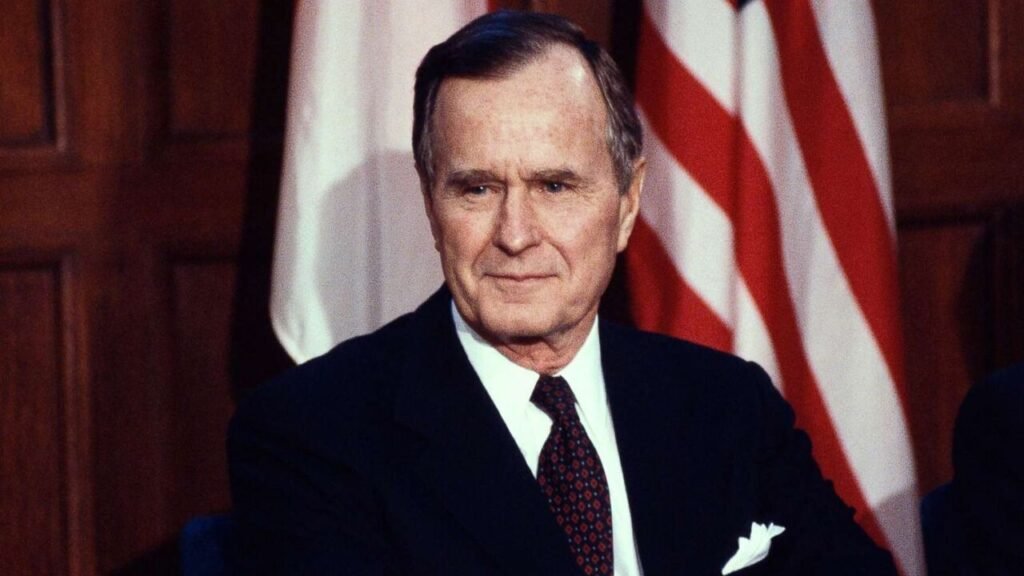
Bush Sr.’s GDP growth was modest at 2.3%, impacted by the 1990–91 recession. Unemployment rose to 7.5%, but inflation remained low at 3.1%. Poverty rates peaked at 14.2%, the highest among modern presidents. His fiscal restraint helped stabilize deficits, but the recession hurt his economic legacy.
Bill Clinton (1993–2001)

Clinton’s economy is often cited as one of the strongest, with GDP growth averaging 3.9% and 22.7 million jobs created (242,000 monthly average). Unemployment fell from 6.9% to 4%, and poverty dropped to 11.3%, the lowest among modern presidents.
Inflation averaged 2.6%, and the stock market soared during the dot-com boom. Clinton’s balanced budget and tech-driven growth earned praise, though the dot-com bubble burst shortly after his term.
George W. Bush (2001–2009)
Bush Jr.’s economy was turbulent, with GDP growth at 2.2% but negative growth during the 2008 Great Recession. Unemployment rose from 4.7% to 7.6%, and poverty increased to 13.2%.
The stock market crashed, losing 5.6% annually. His tax cuts and wars in Iraq/Afghanistan ballooned deficits to $458 billion by 2008. The Great Recession overshadows his record.
Barack Obama (2009–2017)
Obama inherited the Great Recession, with GDP growth averaging 1.6% due to the 2008–09 contraction. Unemployment peaked at 10% but fell to 4.7% by 2017, with 15.8 million jobs added.
Inflation remained low at 1.3%, and poverty dropped to 12.7%. The stock market recovered, gaining 13.8% annually. Obama’s stimulus (American Recovery Act) aided recovery, but slow growth and high deficits ($1.4 trillion in 2009) drew criticism.
Donald Trump (2017–2021)
Trump’s first three years saw solid GDP growth (2.5% average), with unemployment hitting a 50-year low of 3.5% in 2019. Inflation was low at 1.4%, and poverty fell to 10.5%, a historic low.
The stock market reached record highs before the 2020 COVID-19 crash, which caused a 6.5% GDP contraction and unemployment spiking to 14.7%.
Trump’s tax cuts boosted growth but increased deficits to $984 billion pre-COVID. The pandemic distorts his record, but his pre-2020 economy was strong.
Joe Biden (2021–2025)
Biden’s economy saw robust recovery post-COVID, with GDP growth averaging 3.4% through 2024. Unemployment fell from 6.4% to 4.1%, with 16.2 million jobs created.
Inflation peaked at 9.1% in 2022 but dropped to 2.4% by 2024, per the Center for American Progress. The stock market hit record highs, and real wages grew 1.1%. However, high inflation early in his term fueled public dissatisfaction, despite strong metrics.
Comparative Table of Economic Performance
| President | Term | Avg. GDP Growth | Unemployment (End) | Inflation (Avg.) | Job Growth (Millions) | Poverty Rate (End) | Stock Market (S&P 500 Annual) | Key Context |
|---|---|---|---|---|---|---|---|---|
| Truman | 1945–53 | 1.4% | 4.3% | 5.9% | 5.2 | 22% (est.) | +5.5% | Post-WWII transition, recessions |
| Eisenhower | 1953–61 | 3.0% | 6.8% | 1.4% | 3.5 | 19.5% | +10.5% | Stable growth, two recessions |
| Kennedy | 1961–63 | 4.4% | 5.7% | 1.2% | 2.6 | 19% | +12.8% | Short term, tax cuts proposed |
| Johnson | 1963–69 | 5.3% | 3.4% | 2.8% | 11.9 | 12% | +4.4% | Great Society, Vietnam spending |
| Nixon | 1969–74 | 2.8% | 5.6% | 6.2% | 6.1 | 11.1% | -2.5% | Stagflation, oil crisis |
| Ford | 1974–77 | 1.6% | 7.7% | 7.8% | 2.3 | 11.8% | +6.9% | Stagflation, short term |
| Carter | 1977–81 | 3.2% | 7.1% | 9.0% | 10.3 | 11.7% | +6.9% | Oil shocks, high inflation |
| Reagan | 1981–89 | 3.5% | 5.3% | 4.1% | 16.1 | 13% | +14.5% | Tax cuts, debt tripled |
| Bush Sr. | 1989–93 | 2.3% | 7.5% | 3.1% | 2.6 | 14.2% | +12.6% | 1990–91 recession |
| Clinton | 1993–01 | 3.9% | 4.0% | 2.6% | 22.7 | 11.3% | +17.5% | Dot-com boom, balanced budget |
| Bush Jr. | 2001–09 | 2.2% | 7.6% | 2.6% | 1.1 | 13.2% | -5.6% | Great Recession, tax cuts |
| Obama | 2009–17 | 1.6% | 4.7% | 1.3% | 15.8 | 12.7% | +13.8% | Great Recession recovery |
| Trump | 2017–21 | 1.0% | 6.4% | 1.4% | -2.7 | 10.5% | +7.8% | COVID-19 crash, pre-2020 strength |
| Biden | 2021–25 | 3.4% | 4.1% | 4.0% | 16.2 | 11.8% (2023) | +14.1% | Post-COVID recovery, inflation spike |
Critical Analysis: Who Had the Best Economy?
Top Contenders
- Bill Clinton (1993–2001): Clinton’s economy stands out with 3.9% GDP growth, 22.7 million jobs, low unemployment (4%), and a balanced budget. The dot-com boom and tech-driven growth were significant, but his policies (e.g., welfare reform, fiscal discipline) contributed. Critics note the dot-com bubble’s eventual burst, but his metrics are unmatched for sustained prosperity.
- Lyndon B. Johnson (1963–1969): Johnson’s 5.3% GDP growth and 3.4% unemployment are exceptional, with significant poverty reduction. However, rising inflation and unsustainable spending laid groundwork for stagflation, tempering his record.
- Ronald Reagan (1981–1989): Reagan’s recovery from the 1981–82 recession, 16.1 million jobs, and stock market gains earned high marks (EPI score: 90.8%). However, tripling the debt and rising inequality raise questions about long-term sustainability.
- Joe Biden (2021–2025): Biden’s post-COVID recovery was strong, with 3.4% GDP growth, 16.2 million jobs, and unemployment at 4.1%. However, high inflation (9.1% peak) hurt public perception, despite robust metrics.
- John F. Kennedy (1961–1963): Kennedy’s 4.4% GDP growth and low inflation are impressive, but his short tenure limits comprehensive evaluation.
Why Clinton Ranks Highest
Clinton’s economy excels in multiple metrics: near-ideal GDP growth, record job creation, low unemployment, low inflation, and poverty reduction. His balanced budget and tech-driven boom created broad prosperity, though the dot-com bubble’s collapse post-tenure shows external factors’ influence.
Unlike Johnson’s overheated economy or Reagan’s debt-heavy growth, Clinton’s policies balanced growth and fiscal responsibility. Biden’s recovery is notable but marred by inflation, while Trump’s pre-COVID strength was undone by the pandemic.
Why It’s Complicated
Economic performance isn’t solely attributable to presidents. Studies, like Blinder and Watson’s 2016 American Economic Review analysis, show Democratic presidents often oversee stronger economies (4.6% vs. 2.4% GDP growth since 1933), but factors like oil shocks, productivity, and global conditions play larger roles than policy. For example:
- Clinton benefited from the tech boom, not entirely his doing.
- Obama inherited the Great Recession, limiting early growth.
- Trump’s pre-COVID economy was strong, but the pandemic skewed his record.
- Biden faced post-COVID supply chain issues and global inflation pressures.
Presidents inherit economies, and external events (wars, pandemics, oil crises) shape outcomes. The Federal Reserve’s monetary policy, not presidential control, often drives interest rates and inflation.
Conclusion
Bill Clinton likely presided over the “best” economy since WWII, with robust GDP growth, record job creation, low unemployment, low inflation, and a balanced budget. His 1993–2001 tenure saw widespread prosperity, though the dot-com bubble’s burst highlights the role of external factors.
Johnson and Reagan also rank high for growth and recovery, respectively, while Biden’s post-COVID rebound is notable but hindered by inflation perceptions. The table above provides a clear comparison, but context matters—presidents don’t control all variables.
To evaluate economic success, voters and analysts must look beyond raw numbers to inherited conditions, global events, and long-term impacts. For those interested in deeper analysis, sources like the Bureau of Economic Analysis and Blinder and Watson’s study offer valuable insights.